Understanding Map Interactions
The irrigation system map provides a visual representation of the irrigation devices, showing the controllers and the status of different components. This manual will guide you through understanding and using the map interface.
- Map Display: The central area of the interface where the irrigation system layout is displayed. Zones, controllers, and other key components are marked on the map.
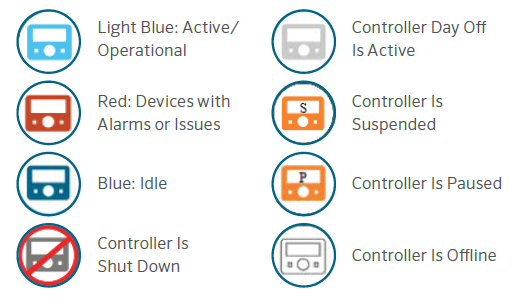
- Controller Legend: Provides explanations for the symbols and color codes used on the map. Typical symbols include:
- Navigation Controls: Controller icon button to view the controller functions. Flow icon button to view flow.
- Status Indicators: Real-time indicators showing the operational status of different zones and controllers.
Examples:
- Active: Zones currently irrigating
- Alarmed: Zones with issues that need attention - Interactive Elements: Clickable zones and controllers that provide detailed information when selected. Pop-up windows with data such as water usage, current flow rate, and last maintenance date.
• Viewing the Map: Open the irrigation system map to get an overview of the entire network. Use the navigation controls to zoom in on specific areas or components.
• Understanding the Legend: Refer to the legend to interpret the symbols and color codes on the map. Ensure you understand what each color and icon represents to accurately assess the system's status.
• Monitoring Status Indicators: Keep an eye on the real-time status indicators to identify active, idle, and alarmed zones.
Still need help? We're here.
Tell us what you need support with and we'll find the best solution for you.